
As organizations begin using Microsoft Fabric for analytics, data engineering, business intelligence, and AI workloads, monitoring Fabric capacity usage becomes increasingly important. Prolonged high resource usage can lead to throttling, resulting in slower processing, delayed data refreshes, and a reduced user experience.
Microsoft Fabric has added Capacity Overview Events functionality to the Real-Time Hub, allowing administrators to monitor capacity usage in real-time and receive immediate notifications when usage exceeds custom thresholds. Instead of waiting for users to report issues, IT teams can detect and resolve problems before they impact system performance.
This article explains how to create a Microsoft Fabric Capacity Alert by setting custom thresholds, and why every Microsoft Fabric administrator should implement this capability as part of system monitoring.
Why should you check Microsoft Fabric Capacity?
Every Microsoft Fabric Capacity unit has limited compute resources.
When many users view reports, refresh semantic models, run Spark Notebooks, or process data pipelines simultaneously, capacity usage increases.
If used at a high level continuously, Microsoft Fabric may begin to throttle resource usage, which may result in the following problems:
- The report is loading slowly.
- Dataset refresh is delayed.
- Notebook processing takes longer.
- Background Jobs are delayed.
- The overall user experience has decreased.
Real-time monitoring allows administrators to detect problems before they affect users.
What are Capacity Overview Events?
Capacity Overview Events (Preview) is a feature within Microsoft Fabric's Real-Time Hub that continuously sends fabric capacity telemetry data.
Traceable information, such as:
- Percentage of Capacity Usage
- Interactive Delay Threshold
- Background Rejection Threshold
- Capacity Health Indicators
This data can be connected to Microsoft Fabric Activator to automate actions when specified conditions are met.
Because data is transmitted in real-time, system administrators can receive immediate notifications without having to periodically check the system manually.
Benefits of setting up Custom Threshold Alerts
Instead of waiting for capacity utilization to reach 100%, organizations can set alert levels that are appropriate for their own operations.
For example:
Usage level | Procedure |
60% | Start tracking usage trends. |
75% | Check the workloads that are currently running. |
80% | Notify the system administrator. |
90% | Investigate and take immediate action. |
100% | There is a risk of capacity throttling. |
Setting a custom threshold allows organizations to...
- Increased usage was detected from the early stages.
- Reduce the chance of unexpected throttling.
- Plan workload usage more effectively.
- Maintain consistent report performance.
- Responding to problems more quickly.
How to set up Microsoft Fabric Capacity Alerts
Setting up Alerts only takes a few minutes.
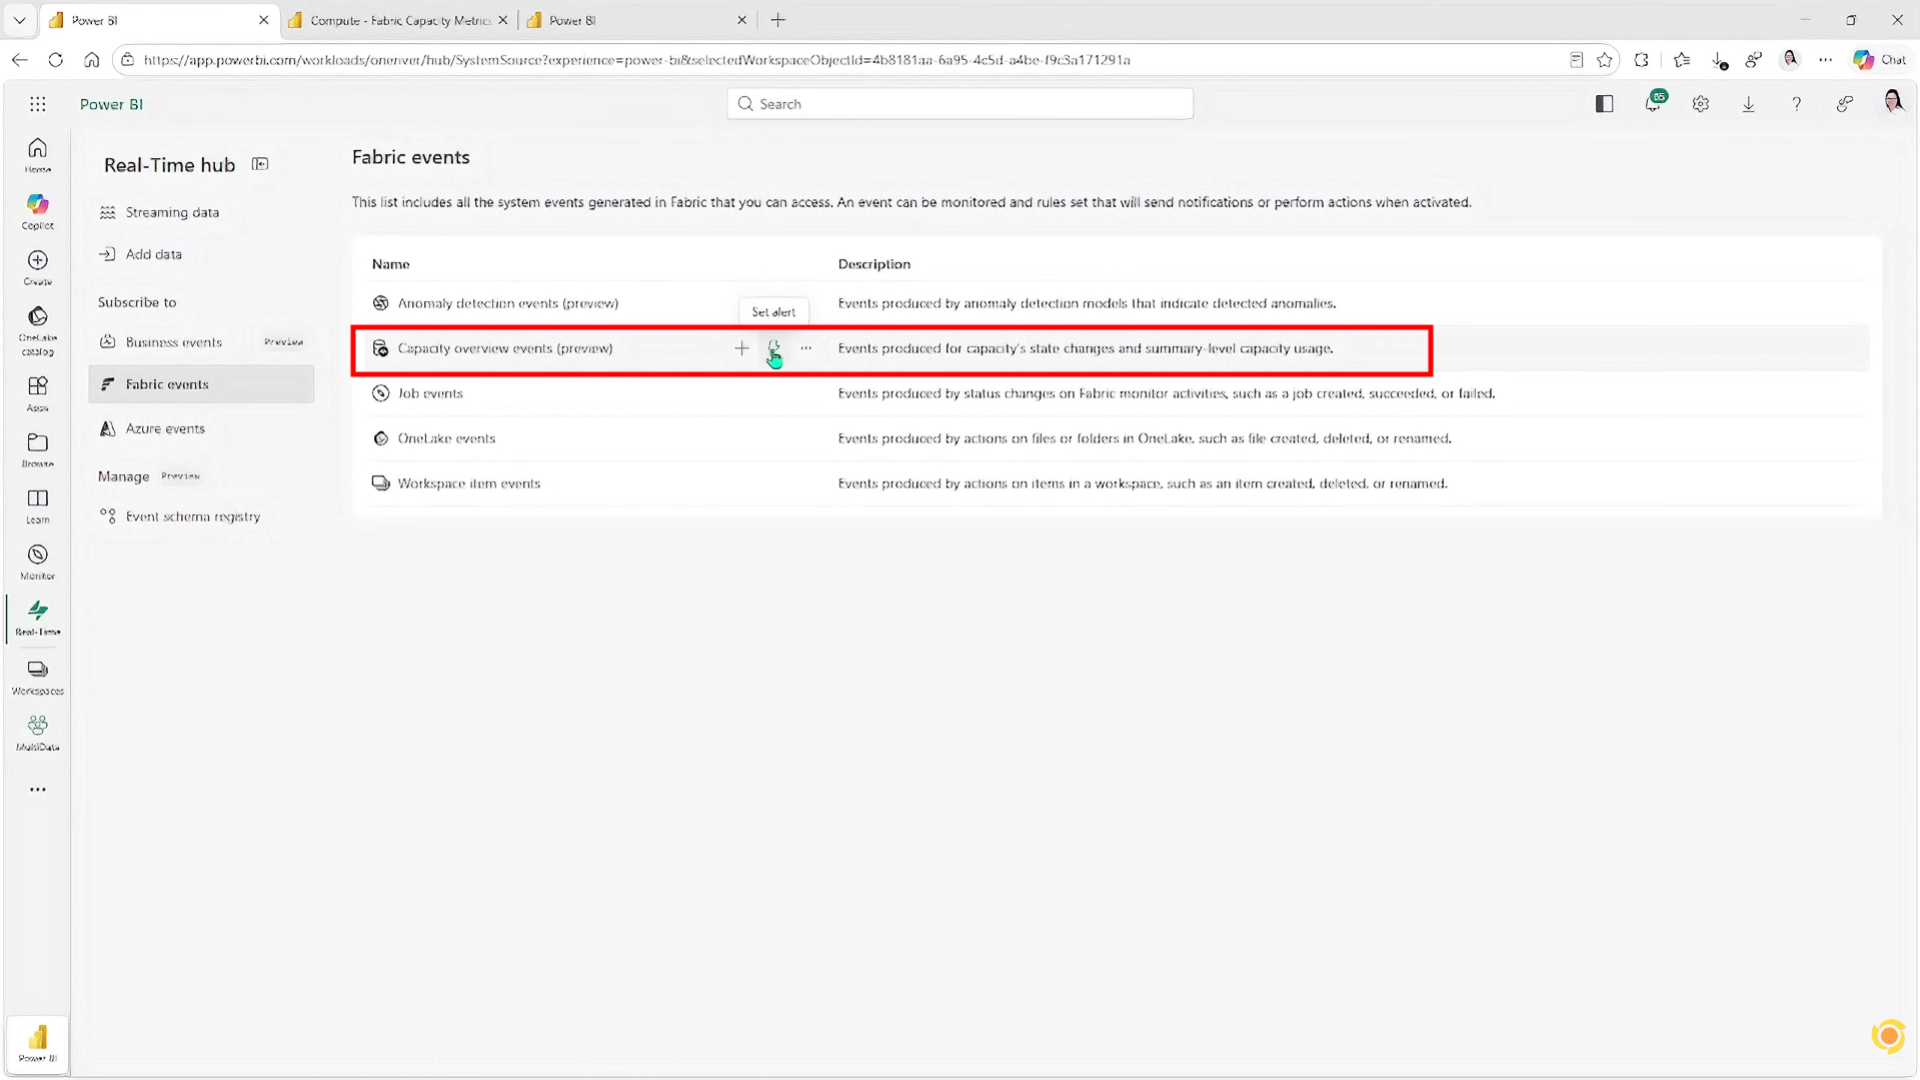
Step 1: Open Capacity Overview Events.
Go to the menu.
Real-Time Hub → Fabric Events → Capacity Overview Events (Preview)
Hover your mouse over Capacity Overview Events and select Set Alert.
The system will open a window for configuring alert rules (Alert Configuration).
Step 2: Name the Rule and select the data source.
In the Details section.
- Specify a name for the Rule, for example:
- High Capacity Usage Alert
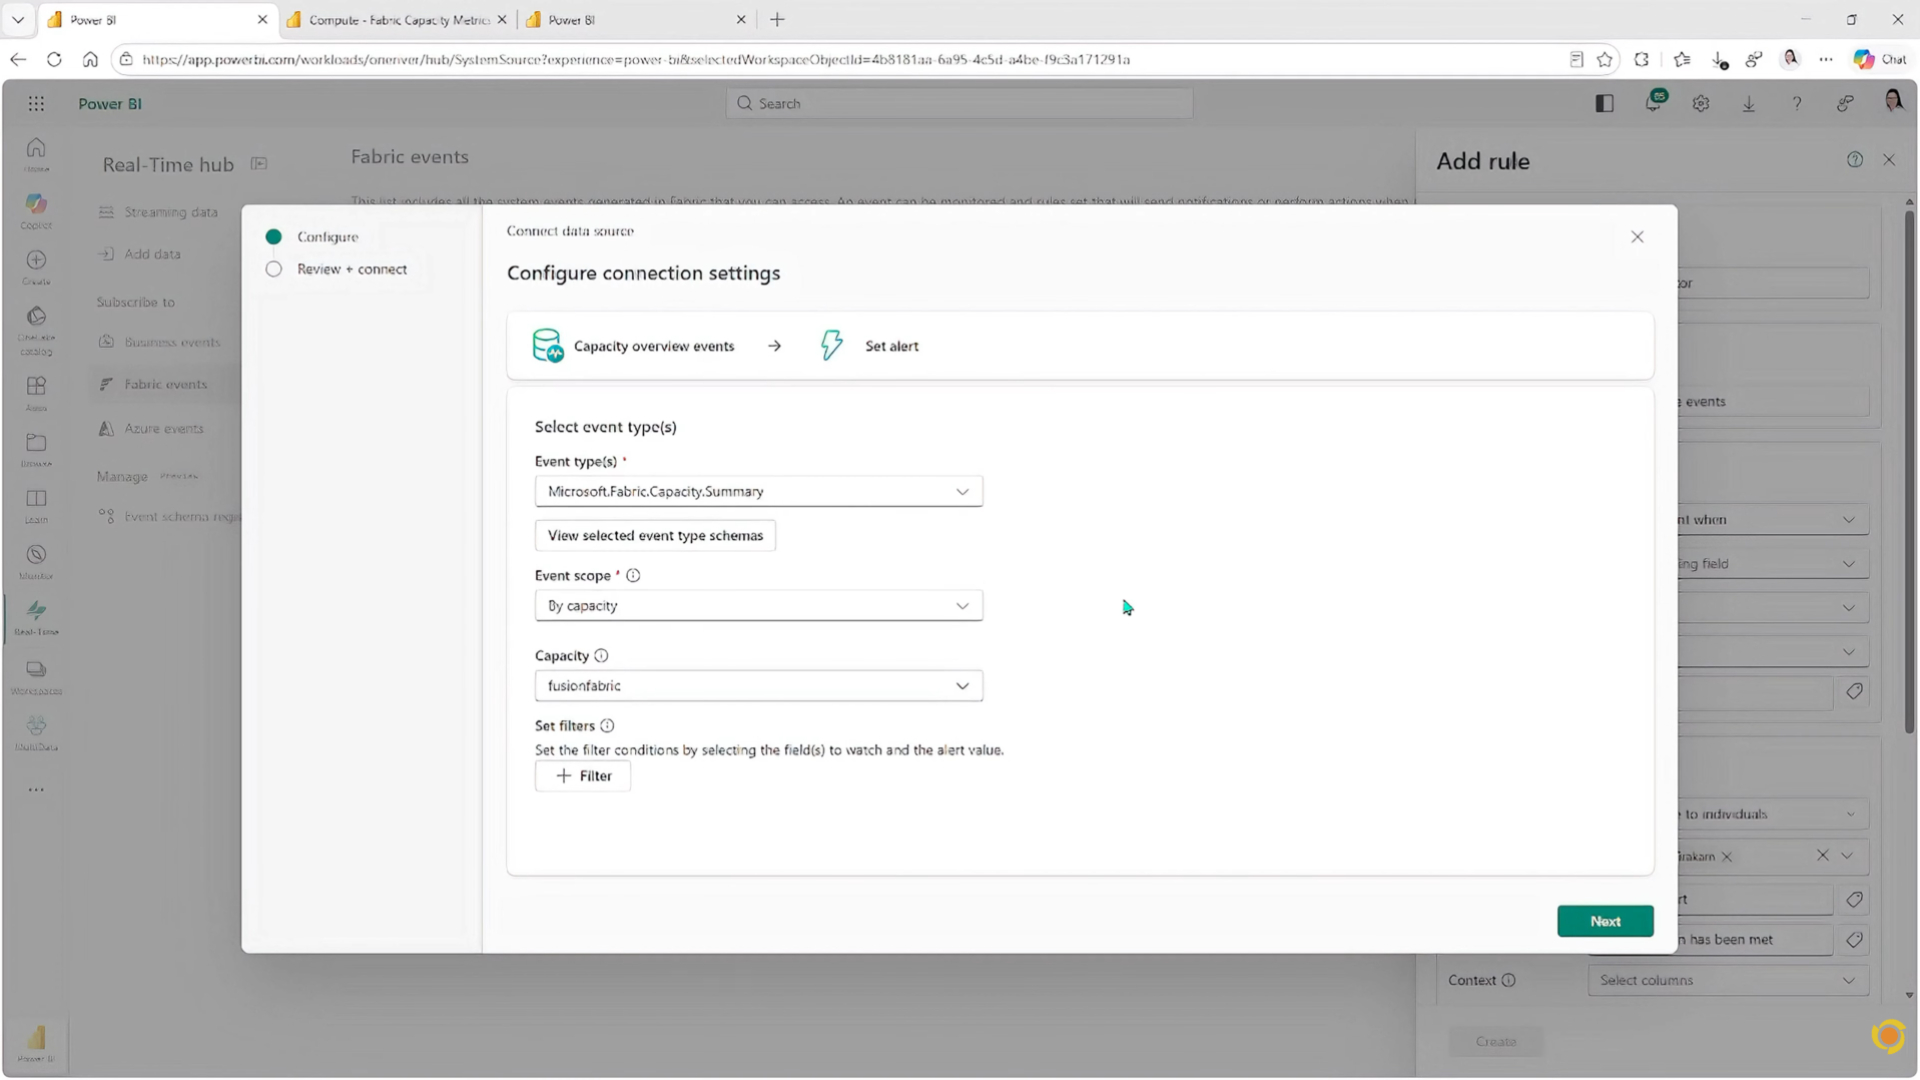
In the Monitor section.
- Select Capacity Overview Events as the data source.
- Choose Microsoft.Fabric.Capacity.Summary
- Select the Fabric Capacity you want to monitor
- Save the data source configuration
Using descriptive rule names makes ongoing management much easier, especially when monitoring multiple Fabric capacities.
Step 3: Configure the Alert Condition
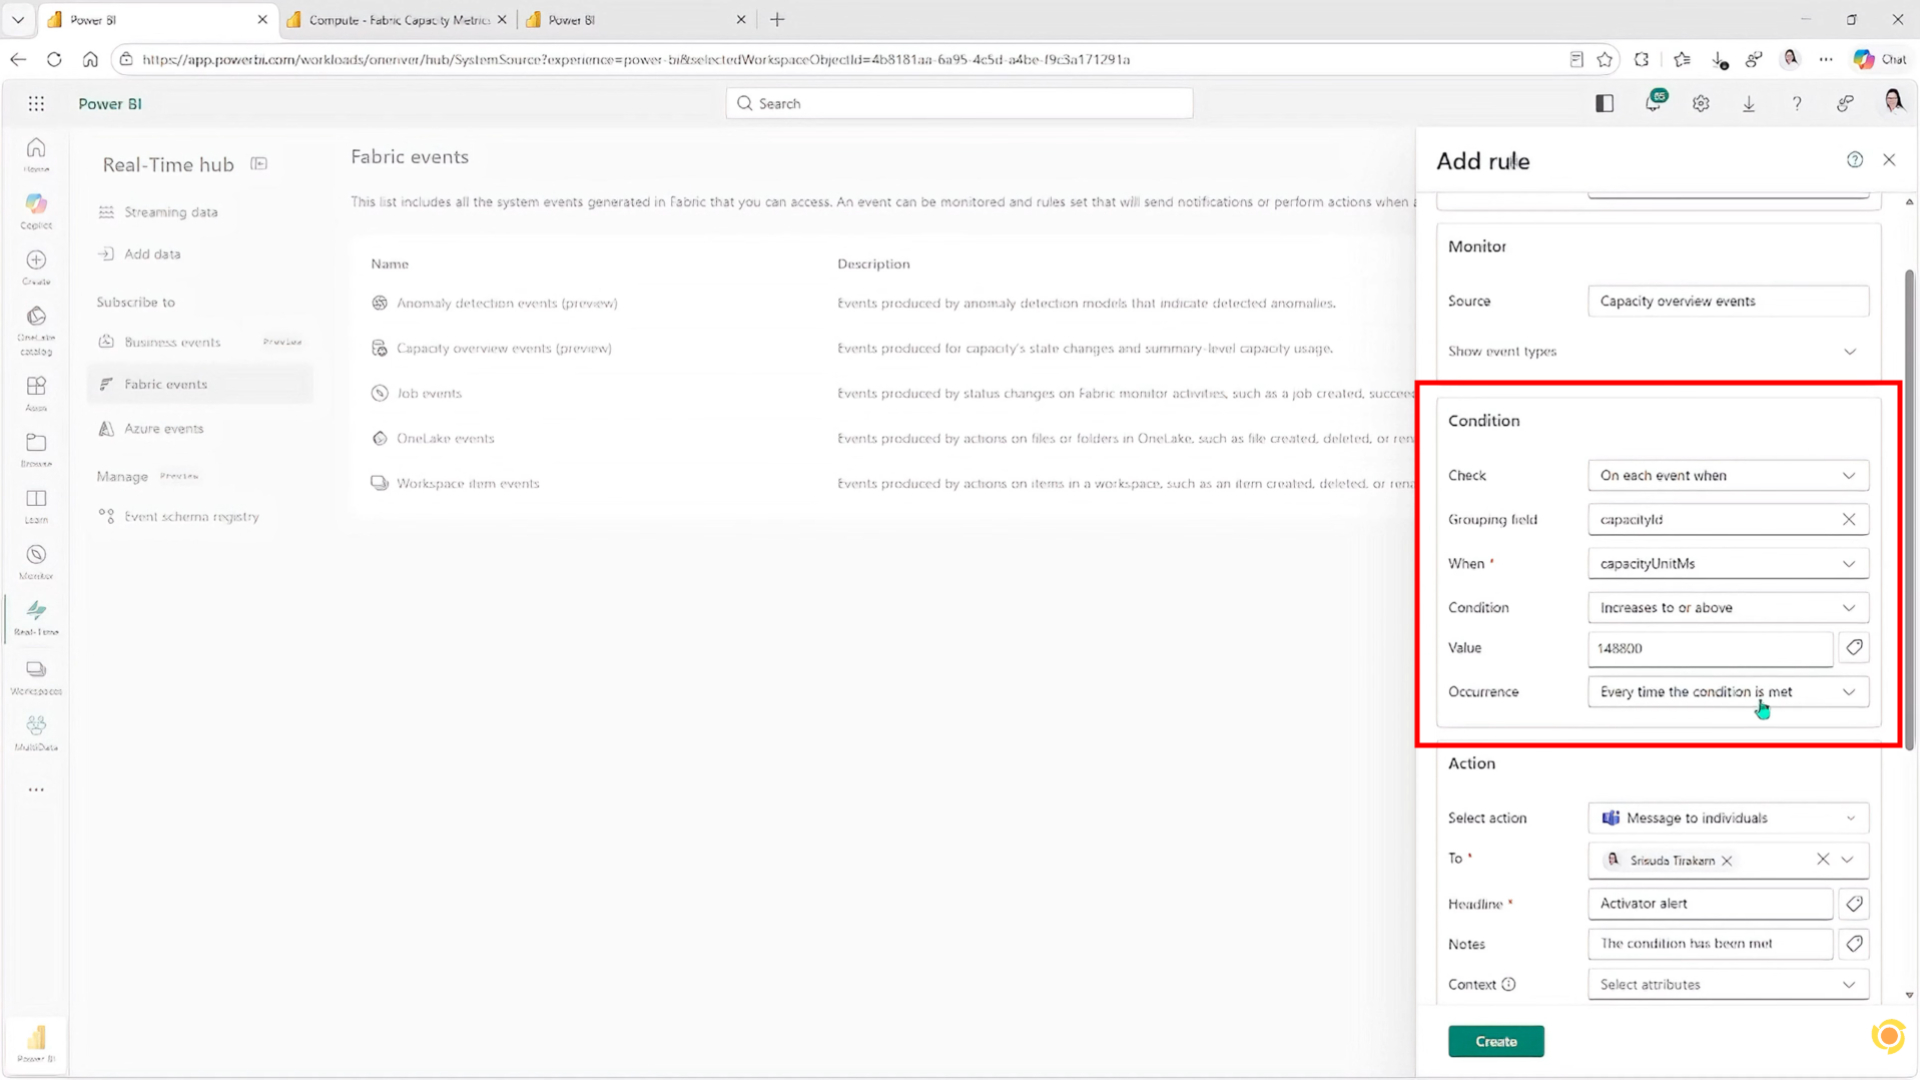
The Condition section determines when the alert should trigger.
Typical settings include:
- Check: On each event grouped by capacityId
- Metric: Select the capacity metric you want to monitor
- Condition: Increases to or above
- Threshold: Example 31%
Microsoft recommends using Grouped Numeric Change conditions instead of sending notifications for every event to prevent sending duplicate notifications when capacity remains high.
The system will only send an alert when the Metric value crosses the defined threshold.
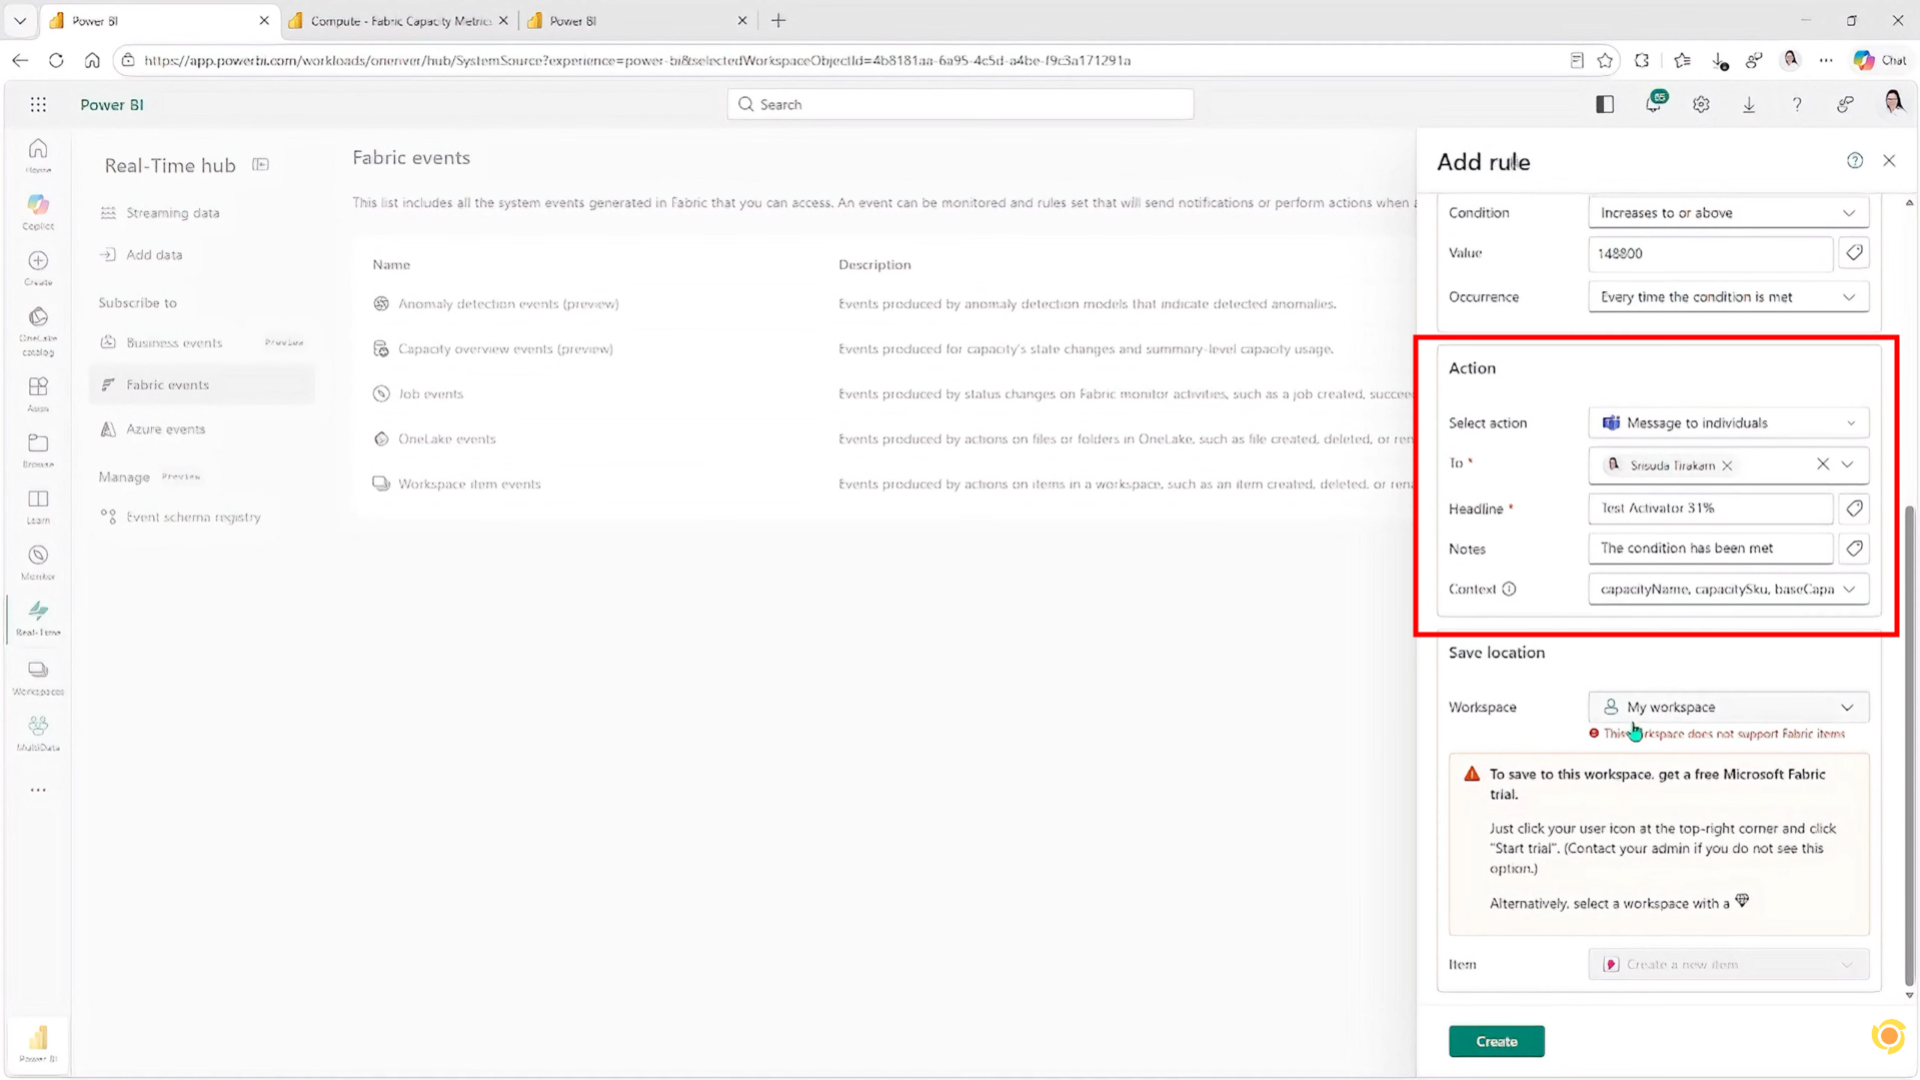
Step 4: Configure the Alert Action
Next, choose what happens when the condition is met.
Common actions include:
- Send a Microsoft Teams notification
- Add a custom subject
- Include alert details
- Insert dynamic event properties such as utilization percentage
For example, Microsoft Team might notify administrators that the configured capacity has exceeded 31% utilization, enabling them to investigate before throttling begins.
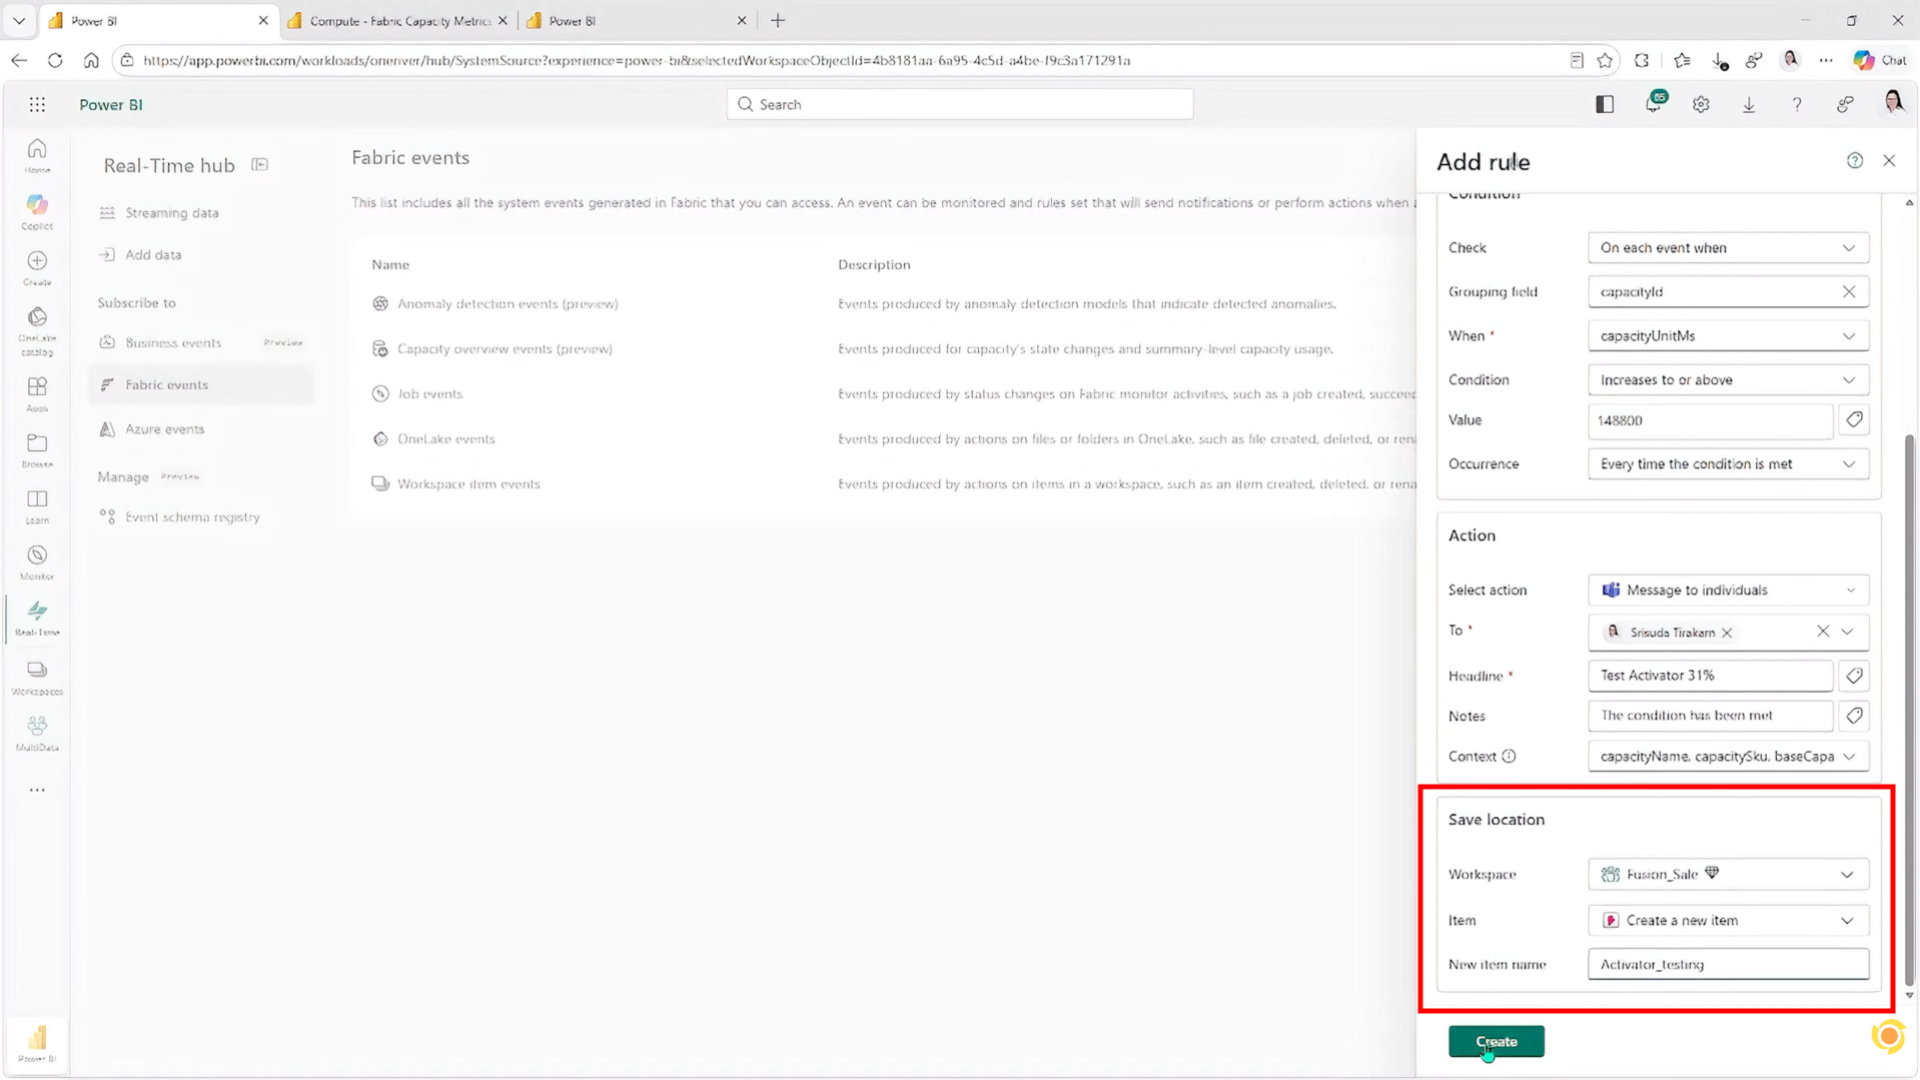
Step 5: Save and activate.
After reviewing the configuration:
- Choose Save
- Activate the alert rule
Microsoft Fabric immediately begins monitoring Capacity Overview Events in real time.
Whenever your configured threshold is crossed, the alert automatically executes the configured action.
Recommended practices for monitoring capacity.
To ensure Fabric Capacity Alerts are as effective as possible, follow these guidelines:
Set the Alert before it reaches 100%.
If you wait until the capacity is fully utilized, users may start to experience the effects.
Configure Alerts around 75–85% to allow time for investigation.
Group Alerts by Capacity
การใช้ capacityId ช่วยให้ระบบแจ้งเตือนเฉพาะเมื่อค่า Capacity ข้าม Threshold เท่านั้น ลดปัญหาการแจ้งเตือนซ้ำในช่วงที่การใช้งานยังคงอยู่ในระดับสูง
Review Workload Trends
Use alert history together with Capacity Metrics to identify recurring workload spikes and optimize scheduling.to identify recurring workload spikes and optimize scheduling.
Separate the critical workloads.
If production and development workloads share the same capacity, consider separating them to reduce competition for compute resources.
Separate the critical workloads.
Alerts are most effective when there are clear response procedures, such as:
- Check the tasks that take a long time to process.
- Stop unnecessary refreshing.
- Increase capacity when necessary.
Increase capacity when necessary. Video tutorial on setting up Microsoft Fabric Capacity Alerts.
Increase capacity when necessary. Video tutorial on setting up Microsoft Fabric Capacity Alerts.