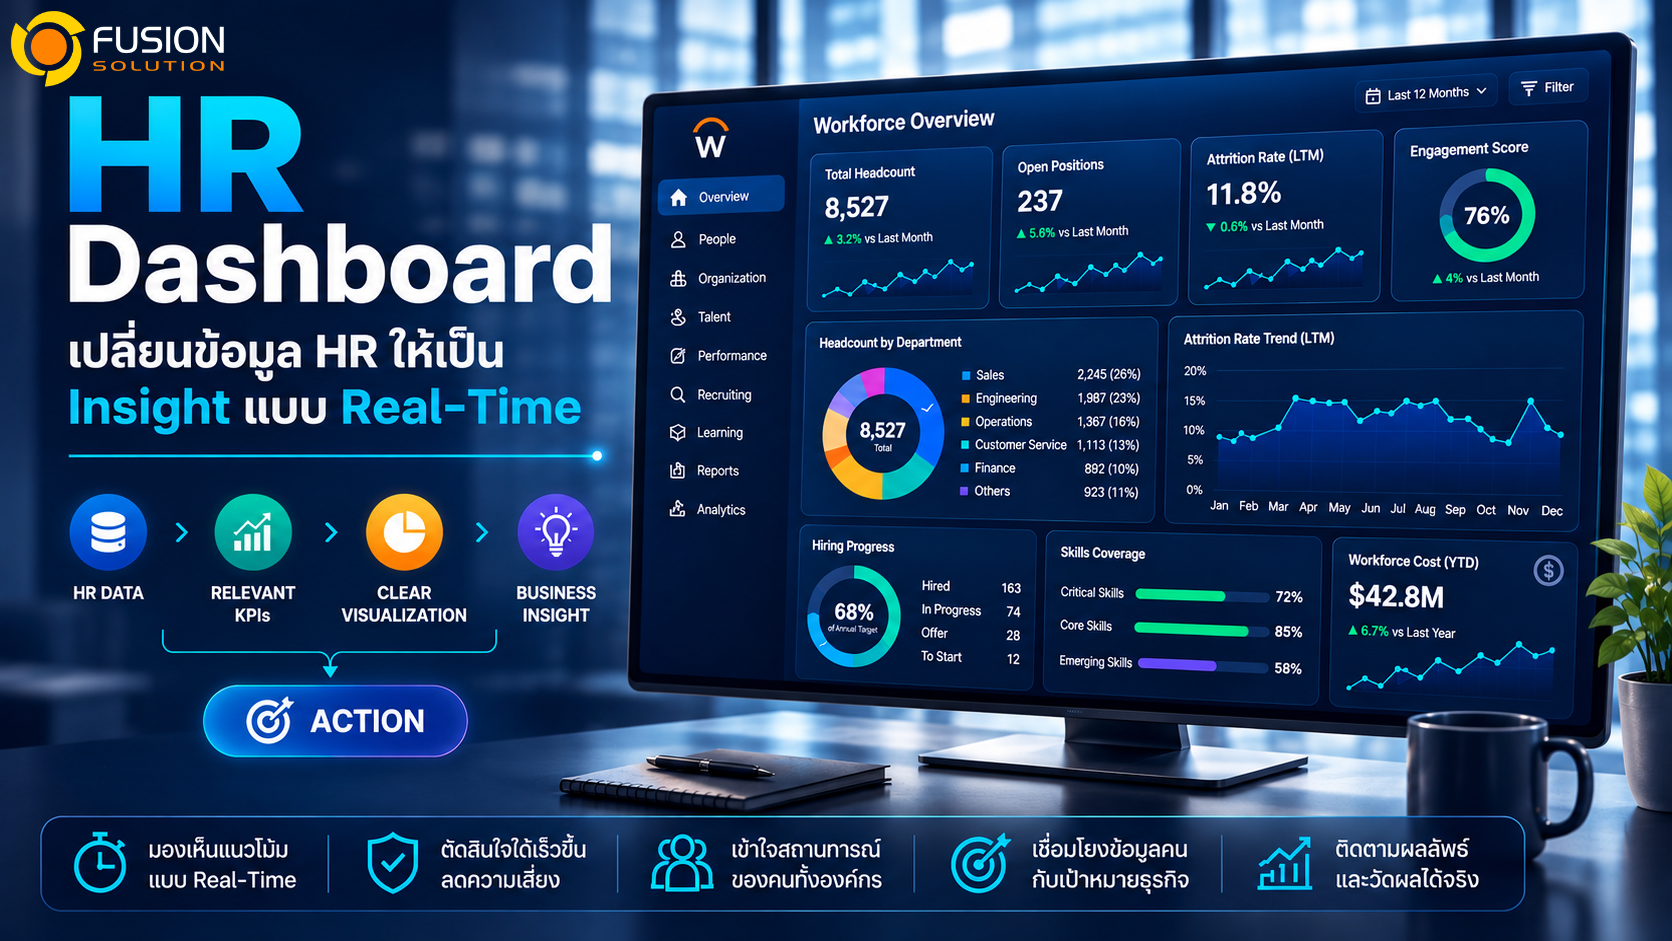
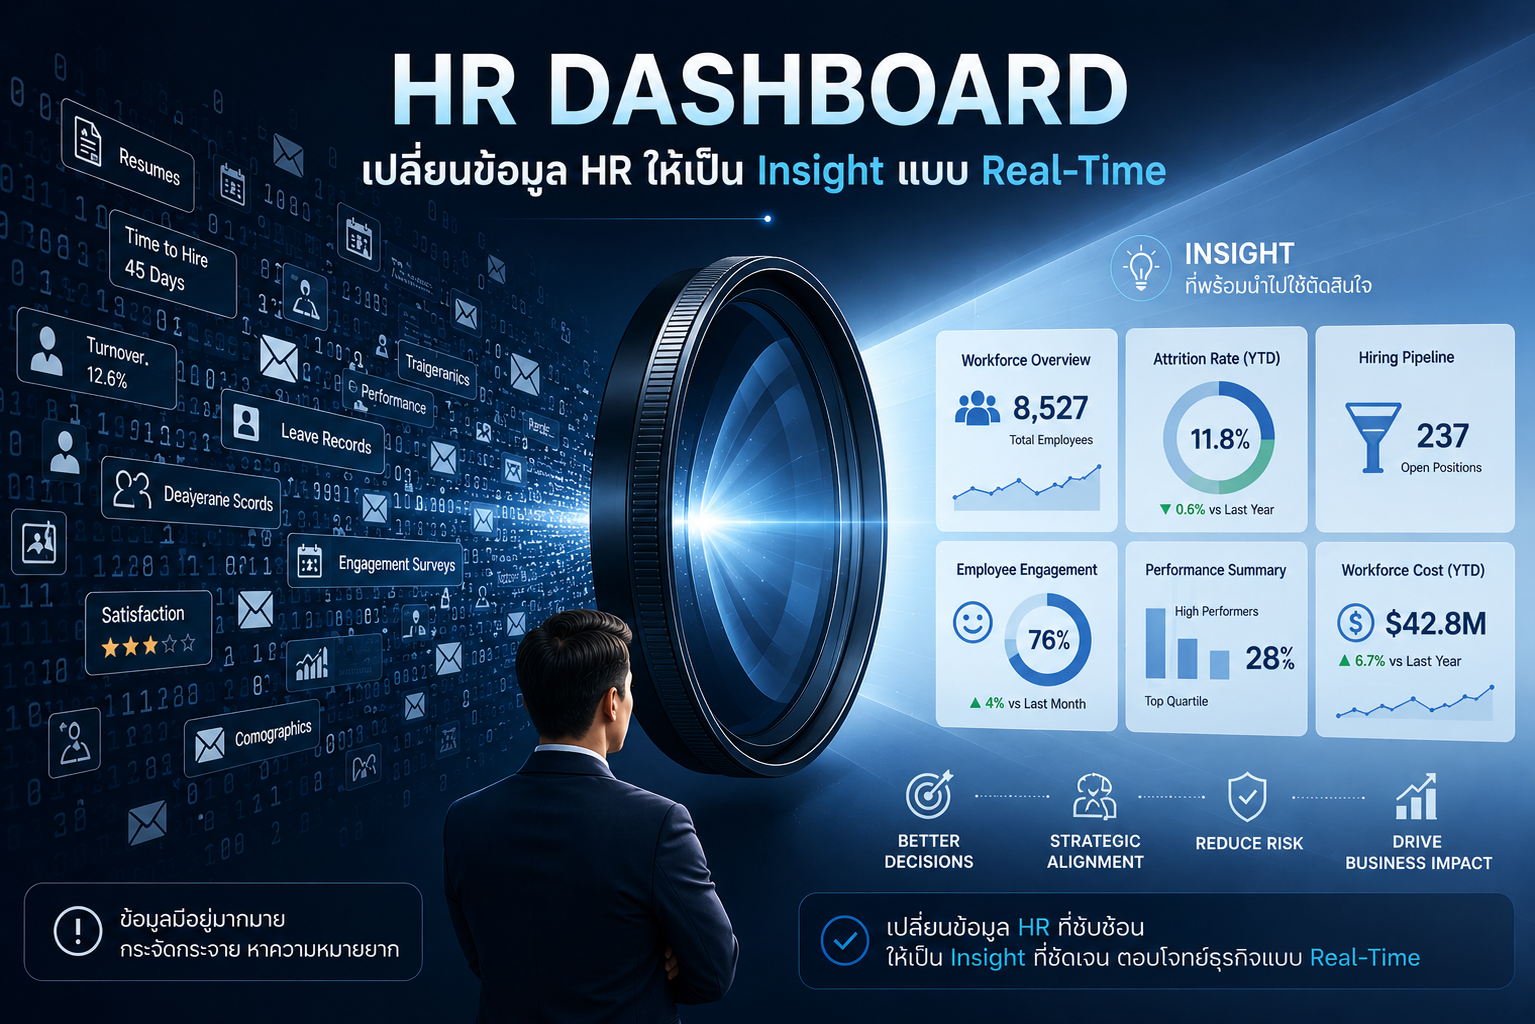
Many organizations have a large amount of HR data, including headcount, hiring, attrition, engagement, performance, learning, skills, absence, and workforce cost. However, this data is often scattered across multiple systems, files, and reports, requiring HR to spend time collecting, verifying, and preparing presentations before submitting them to management.
When information is slow to become available, decisions may only be made after the problem has begun to affect the business. For example, key positions may remain vacant longer than usual, turnover rates may increase in certain teams, or workforce costs may exceed the budget.
Even if an organization already has a dashboard, if the screen is cluttered with numerous graphs and numbers without any prioritization, users may still be unable to answer questions about what is happening, where trends are changing, where the risks lie, and what the organization should do next.
The goal, therefore, is not to display all the information on a single screen, but to select the information relevant to the decision-making process and present it in a way that allows users to quickly understand the situation.
HR Data ↓ Relevant KPIs ↓ Clear Visualization ↓ Business Insight ↓ Action
When HR data needs to be readily available for decision-making
Executives don't need to see every employee detail, but they do need an overview of trends, risks, and business-related impacts. HR may require in-depth analysis to determine root causes, managers need team-specific data, and Finance needs workforce cost, budget, and forecast information.
The HR Dashboard is a screen that collects and presents personnel-related data, indicators, trends, and risks in an easy-to-understand format to support monitoring and decision-making for various user groups.
- Number of employees and workforce structure.
- Job openings and recruitment progress.
- Attrition, Retention, and Employee Engagement
- Performance, Learning, and Skills
- Internal Mobility, Absence and Workforce Cost
A screen with a lot of information doesn't always mean it's more valuable. True value arises when users see the key points, understand the meaning of the data, and use the insights to make decisions faster.
How is it different from an HR Report?
HR Report | HR Dashboard |
Show details | Summary, trends, and risks. |
They are usually accessed in cycles or upon request. | Used for continuous monitoring of the situation. |
Suitable for detailed inspection and analysis. | Suitable for monitoring and decision-making. |
It may consist of multiple pages. | Focus on key KPIs from a single perspective. |
Users need to search for and interpret information. | Makes important issues visible more quickly. |
has a fixed pattern. | Designed according to the user's role. |
For example, an Attrition report might detail the resignation, date, department, position, length of service, and reason, while a Dashboard might summarize which departments are experiencing an increase in resignations, which groups are affected, and how trends have changed compared to previous periods. Both formats complement each other, but do not entirely replace each other.
Why is an HR dashboard important?
Decisions regarding people impact costs, efficiency, business continuity, and employee experience. If data is slow to become available, or if different parties are using different sets of figures, organizations may spend time verifying which data is correct instead of analyzing and making decisions.
- Reduce the time spent compiling reports.
- Use consistent KPI definitions.
- To see trends and risks more quickly.
- Separate the data to suit each user group.
- Supporting collaboration between HR, Finance, and Business.
- Link employee data with business objectives.
- Follow up on the results after implementation.
For example, if turnover rates increase along with declining engagement scores in some teams, HR can identify areas for further investigation faster than waiting for quarterly reports. Or, if hiring progress is below plan in revenue-impacting positions, management can prioritize and adjust recruitment resources more quickly.
Important information that should be included
Headcount and Workforce Composition
Consider the number of employees, team structure, location, type of employment, new hires, employee movement, and span of control.
Hiring and Vacancy
Track Open Positions, Vacancy Rate, Time to Fill, Offer Acceptance, Hiring Progress, and Candidate Pipeline.
Attrition and Retention
Analyze Voluntary Turnover, Regrettable Turnover, Retention Rate, Tenure, and Critical Talent Loss.
Employee Engagement
Track Engagement Score, Participation, Drivers, Manager Effectiveness, Recognition, and Growth Opportunities.
Performance
See Goal Completion, Review Completion, Check-In Frequency, Development Progress and High Performer Retention.
Learning and Skills
Track Learning Completion, Critical Skills Coverage, Skills Gap, Certification, and Upskilling Progress.
Internal Mobility and Career Growth
See Internal Fill Rate, Promotion, Lateral Movement, Mobility by Department and Retention after Internal Move.
Absence and Workforce Availability
Track Absence Rate, Leave Trends, Overtime, Schedule Coverage, and Capacity.
Workforce Cost
It links Total Workforce Cost, Salary and Benefits, Contractor Cost, Budget versus Actual, and Forecast.
Organizations don't need to display every KPI on the main page; they should select only the data relevant to the business question and that will help users make better decisions.
How should the dashboards for each group differ?
User | Things that should be seen |
HR | Insights from Drill Down, Attrition Drivers, Hiring Funnel, Skills Gap, Mobility, and Talent Risks. |
Manager | Team-specific information such as Headcount, Goal Progress, Review Status, Learning, Absence, and Development Actions. |
Executive | Overview of Workforce Growth, Critical Talent Risk, Cost, Leadership Pipeline, Critical Skills, and Workforce Readiness. |
Finance | Position Budget, Workforce Cost, Budget versus Actual, Contractor Cost, Forecast and Scenario Impact. |
Giving all user groups the same screen might make the information too complex or pose a privacy risk. Therefore, the design must consider the questions, the level of detail, and access rights.
How Should Organizations Select HR KPIs?
Connect to the Business Question
Each KPI must help answer questions that are important to the business.
Create Clear Definitions
Headcount, Turnover, Vacancy, High Performer, and Critical Role must be calculated consistently.
Assign Ownership
Refresh timing should match decision timing; not every metric needs continuous updates
Use the Right Update Frequency
The update timing must synchronize with the decision-making timing; it doesn't need to be real-time for every update.
Provide Context
Use previous-period comparison, target, trend, workforce segment, or business impact
Ensure the KPI Can Lead to Action
If a metric has no relationship to a decision, it may not belong on the primary dashboard
What Does Real-Time HR Data Mean?
Real-time does not mean every workforce metric must change every second. In an HR context, information should be sufficiently current and available when users need to make a decision, with less dependency on manual consolidation and validation.
- Headcount and employee movement may update from the system of record
- Hiring progress may update when candidate stages change
- Absence may update through employee transactions
- Engagement may update according to survey cycles
- Performance may update through check-ins or review cycles
Therefore, the freshness of data must be defined according to the nature of the data and its intended use, not by using the term "Real-Time" as a single goal for all indicators.
How Can Technology Support HR Dashboards?
- Configurable Dashboards
- Self-Service Analytics
- Role-Based Access
- Real-Time Workforce Data
- Drill-Down Analysis
- Automated Insights
- AI-Generated Narratives
- Alerts and Notifications
- Connected HR and Finance Data
- Data Security and Governance
Technology can help reduce version control issues and delays from multiple spreadsheet files, but it cannot solve undefined KPIs or poor-quality data. Organizations still need data ownership, access control, governance, and responsible data usage guidelines.
How to get started creating an HR Dashboard
- Let's start with a Business Question
Specify the questions you want answered, such as: Why is turnover increasing? Which key positions remain vacant for a long time? Or, is workforce cost within budget?
- Identify the primary user.
Specify whether it's designed for HR, Manager, Executive, or Finance.
- Select the necessary KPIs.
Select only the metrics that influence the question and decision-making.
- Define the data.
Clearly specify the calculation method for Source and Owner.
- Check Data Quality
Review for completeness, accuracy, currency, and consistency.
- Designing a Visual Hierarchy
Place important information where it's easily visible, use colors meaningfully, and minimize distractions.
- Tested with users.
Ensure that users understand the information and can answer key questions without needing HR to explain it every time.
- Track usage and results.
Assess whether the screen helps reduce report writing time and leads to action.
A good dashboard isn't just about having pretty graphs.
Beautiful graphs may make data look appealing, but they don't guarantee better user decision-making. Effective screens must be aligned with the goal, making trends and exceptions easily visible, providing contextual drill-downs when necessary, using consistent colors, and avoiding displaying unnecessary personal information.
For example, displaying Turnover with large numbers might suggest a change in the situation, but a better screen should help show which groups have seen increased Turnover, how it compares to the previous period, and whether it relates to Critical Talent.
Common errors
Displaying too many KPIs.
When all the information is equally important, users won't know which point to look at first.
Using unnecessarily complex graphs.
Complex patterns add time to understand.
There is no Target or Comparison.
Figures without a target, trend, or benchmark are difficult to interpret.
Using unreliable information.
If the figures don't match other reports, confidence will immediately drop.
Not designed according to role.
Giving Managers the same access to information as Executives may be inappropriate and increase privacy risks.
Built but not improved.
Business questions and KPIs change with strategy, so they need to be reviewed continuously.
Responsible use of information.
- Data Privacy
- Role-Based Security
- Data Minimization
- Transparency
- Fairness
- Data Retention
- Ethical Use
- Human Oversight
Data should be presented at a level appropriate to the purpose and user rights. When analyzing small groups of employees, consider the risk of individuals being identified even without direct naming. Insights should not be used to automatically judge individuals, but rather as signals to aid in investigation and decision-making within context.
Summary
The HR Dashboard is a tool that collects and presents KPI data, trends, and workforce risks to support situation monitoring and decision-making. Its value isn't in the number of graphs, but in its ability to help users understand what's happening, what's important, where the risks lie, how trends are changing, and what to do next.
When data is of high quality, KPIs are clearly defined, and screens are designed according to HR roles, reporting time can be reduced, insights improved, and management decision-making better.