In today's data-driven business world, accurate and timely decision-making is crucial. Microsoft Power BI is one of Microsoft's most powerful data analytics tools, enabling businesses to transform raw data into visually insightful information.
This article will guide you through what Power BI is, why organizations should use it, its key features, and compare it to other tools to help you choose the best solution for your organization.
What is Microsoft Power BI?
Power BI is a Business Intelligence (BI) tool that helps organizations collect, analyze, and present data in an easy-to-understand format through dashboards and interactive reports.
How does Power BI work?
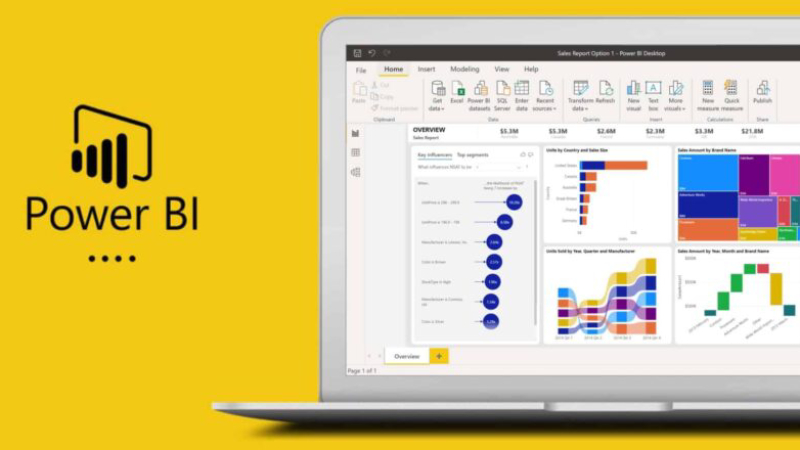
Power BI serves as a platform for extracting data from multiple sources, transforming data, and visualizing data in the form of graphs and visuals that help users easily understand the data.
- Data connection - Supports extracting data from Excel, SQL Server, Google Analytics, and cloud data sources.
- Data Transformation – Use Power Query to format and refine data before analysis.
- Creating dashboards and reports. – Create interactive graphs, tables, and charts to make data easier to understand.
The importance of a strong data model in Power BI.
Another key concept behind Power BI's effectiveness is the data model. After importing and transforming the data, Power BI allows you to create relationships between multiple tables, similar to designing a relational database structure.
A properly designed data model links sales, customer, product, and time dimensions into a single structure, enabling accurate cross-analysis and supporting advanced calculations with DAX (Data Analysis Expressions).
When data models are efficiently refined and structured, organizations can...
- Improve the speed and efficiency of report display.
- Ensure consistency in metrics across all dashboards.
- Create a data analysis framework that can accommodate the growth of data volume.
- Supports more complex business logic in the future.
Why should organizations use Power BI?
1. Analyze data in real time.
It helps organizations track data in real-time and enables executives to make quick decisions.
2. Easy to use, no coding required.
Even without a data science background, you can instantly create reports and dashboards using drag-and-drop functionality.
3. Supports a variety of data sources.
It can connect to databases both on-premises and in the cloud, such as Azure, SQL Server, Google BigQuery, and external APIs.
4. Cost savings.
Power BI is relatively inexpensive compared to other BI tools like Tableau or QlikView, with Power BI Free available for basic use and Power BI Pro for advanced features.
5. Enterprise-level data security.
Supports Role-Based Access Control (RBAC) and Data Encryption to protect critical organizational data.
What does Microsoft Power BI include?
Version | Key features | Suitable for |
Power BI Desktop | Free to use, create dashboards on your device. | Data analyst |
Power BI Pro | Share reports online, supports collaboration. | Small and medium-sized organizations |
Power BI Premium | Supports Big Data, AI, and advanced computing. | Large organizations |
Power BI Mobile | Works on iOS and Android mobile devices. | Executives who need to access information everywhere. |
What can Power BI be used for?
- Sales and revenue analysis.
Businesses can use Power BI to examine sales figures, costs, profits, and market trends.
- Customer behavior analysis
Retail & E-commerce – Analyze purchasing behavior.
Marketing Analytics - Measuring the performance of advertising campaigns and user behavior.
- Human Resource Management (HR Analytics)
Analyze Turnover rates, employee performance, and employment.
- Inventory Management
Track inventory and forecast sales trends
Compare Power BI with other BI tools
Feature | Power BI | Tableau | Google Data Studio |
Price | Cheaper | More expensive | Free |
Usage | Easy to use | Basic knowledge is required | Easy to use |
Big Data Processing | Supported (Premium) | Supported | Limit |
Data connection | various | various | Limit |
How to get started with Power BI
- Download Power BI Desktop from the Microsoft website.
- Connect data For example, Excel, SQL, or Google Analytics.
- Convert and format data with Power Query
- Create dashboards and reports by dragging and dropping graphs and tables.
- Share information with the team Via Power BI Service
Who is Power BI suitable for?
- Businesses of all sizes – Used in strategic decision-making.
- Data Analyst – Create reports and analyze data.
- Marketing Teams – Track customer behavior and ROI.
- Finance Teams – Analyze budgets and market trends.
Summary
Power BI is a data analysis and business intelligence tool that helps organizations of all sizes easily access data, analyze data in real-time, and create professional, interactive reports.
If you need a powerful, easy-to-use, and cost-effective platform, Power BI is the perfect choice for your business.
For more information, please visit... Official Power BI website
You can learn more about importing data from Excel and creating dashboards in Power BI in this article, which provides detailed steps for connecting and displaying data from Excel in Power BI.