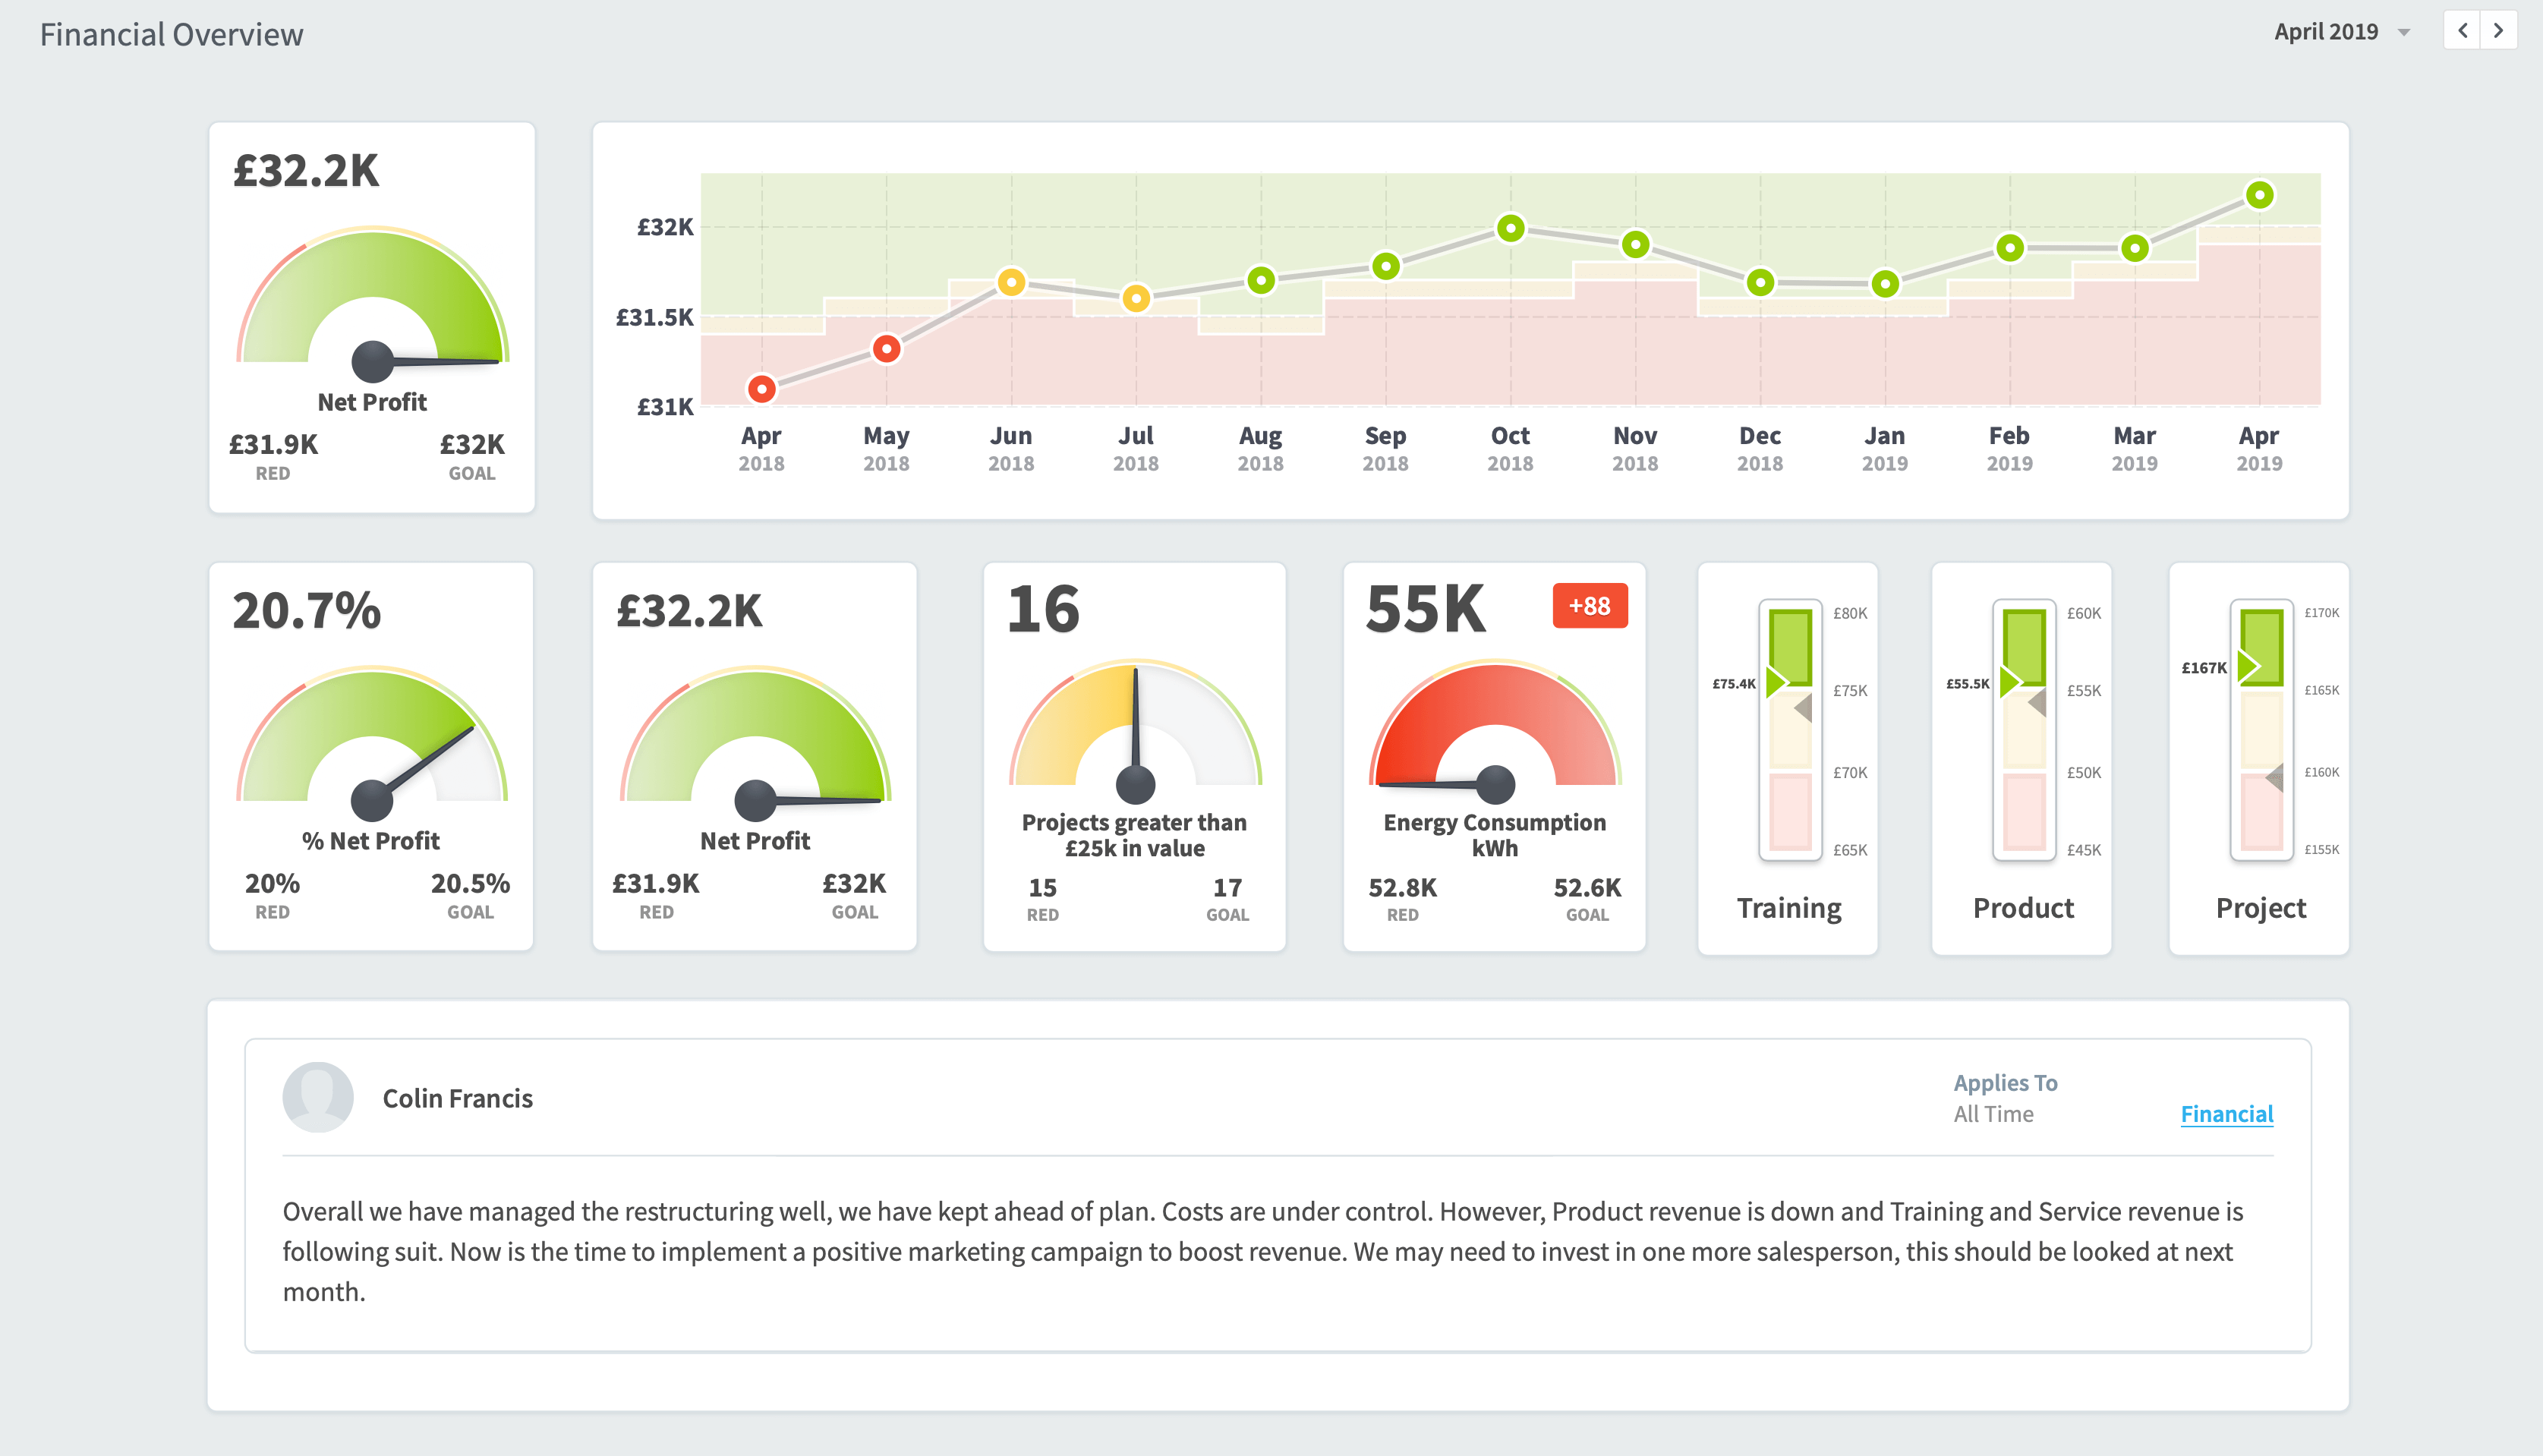
KPI Key Performance Indicator
KPI คือ “ดัชนีชี้วัดความสำเร็จ” เป็นตัววัดคุณค่าที่ประเมินผลออกมาเป็นตัวเลข/จำนวน/ปริมาณได้ชัดเจนและแสดงให้เห็นว่าบริษัทหรือพนักงานนั้นมีศักยภาพเพียงไร หรือประสบความสำเร็จตามวัตถุประสงค์ ซึ่งการทำสามารถใช้เครื่องมือ Power BI ในการทำได้อย่างรวดเร็ว และ ประหยัดค่าใช้ง่ายเนื่องจากเป็น License แบบฟรีอีกด้วย
KPI ที่ดีควรเป็นอย่างไร
อย่างแรกคือ ต้องเข้าใจว่า ดัชนีชี้วัดความสำเร็จ ไม่ใช่รายงานประจำวัน ข้อมูลที่นำมาแสดงต้อง น้อย และไม่สับสน แสดงเป้าหมายการทำงานที่ชัดเจน ส่วนในเรื่องข้อมูลดิบในการทำงานและเป็นต้นทางของข้อมูลนั้นไม่จำเป็นต้องนำมาเสนอในระดับ Dashboard
- การกำหนด ดัชนีชี้วัดความสำเร็จ ควรมีผลต่อผลตอบแทนพนักงาน จะช่วยให้พนักงานใส่ใจในเป้าหมายมากขึ้น
- ต้องวัดได้ บางเรื่องถ้าวัดไม่ได้ไม่ควรเอามาเป็นเป้าหมาย เพราะจะทำให้สับสน
- เป้าหมายในทุกระดับชั้นควรมีความสัมพันธ์กัน จะทำให้ทุกระดับในการทำงานมีเป้าหมายการทำงานที่สอดคล้อง
ตัวอย่างรูปแบบดัชนีชี้วัดความสำเร็จของแต่ละแผนก จะมีหัวข้อที่ไม่เหมือนกัน ขึ้นอยู่กับภาระกิจของแต่ละแผนก
- แผนกขาย หรือ การตลาด
- Sales value
- Number of Products (pieces/type)
- Number of new customers
- Number of new customer visits
- ฝ่ายผลิต
- % Combined Yield
- % Reject
- % Rework
- % Reprocess
- ฝ่ายตรวจสอบคุณภาพ
- จำนวนชิ้นงานเสียที่เกิดขึ้นในหน่วยงานถัดไป
- จำนวนชิ้นงานต่อเดือน
- จำนวนชิ้นงานต่อคนต่อชั่วโมง
- จำนวนครั้งที่มีการตรวจซ้ำ
- จำนวนข้อร้องเรียนของลูกค้าเนื่องจากการตรวจสอบ
Fusion Service
- จัดทำ KPI Dashboard
- ดึงข้อมูลจากระบบต่าง ๆ เข้ามาอัตโนมัติ
- ออกแบบวาง concept ของ Dashboard
เราต้องมี KPI แยะแค่ไหน
มองในระดับบุคคล ตัว ดัชนีชี้วัดความสำเร็จ ไม่ควรมีเกิน 4 ตัว เพราะถ้ามากไปจะทำให้การทำงานที่ต้องมุงเน้นอยากจะไม่ประสบความสำเร็จเลย ซึ่งตัว ดัชนีชี้วัดความสำเร็จ จะต้องมีระยะเวลากำหนดไว้ชัดเจนว่า ระยะเวลาที่ใช้ ดัชนีชี้วัดความสำเร็จ คือเท่าไหร่
ระบบ Business Intelligent มาช่วยเรื่อง KPI ยังไง
ทำให้การออกรายงาน Dashboard สามารถเป็นไปอย่างอัตโนมัติ โดยเจ้าหน้าที่ไม่จำเป็นต้องมาเตรียมรายการ เนื่องจาก Power BI มีความสามารถในการดึงข้อมูลจาก Process การทำงานปกติของพนักงาน
SERVICE BY FUSION SOLUTION
- consultant
- Install and Implement Reporting Server
- Design Dashboard
- Development Data Analytic
- Design SQL Cube
- Data Warehouse Design
- Training
- Design ETL Process
- Fusion Master Data Management (A ready-made application that helps manage and prepare data before ETL)
- Config On Cloud without using Data Warehouse
- Template for Business


Questions about POWER BI
- Is it free?
- There is a free version available. You can download it and try it out. It's called Power BI Desktop.
- What are the limitations of the free desktop suite?
- There are several issues, the most important being that the desktop doesn't have a portal, which means you can't share data.
- What is Premium?
- Flexibility to distribute reports widely across the organization, without requiring individual user permissions for each recipient.
- The volume and performance are higher than the capacity provided in the service.
- Ability to maintain BI assets within the organization with a report server.
- One Surface API provides the latest capabilities and feature access for consistent embedded analytics.
- What can Premium do? How does it work?
- Premium includes capacity in the service, allocated specifically to each organization. Capacity is backed by hardware managed solely by Microsoft. Organizations can choose to deploy their capacity broadly or allocate it to specific workspaces based on user numbers, workload demands, or other factors, and scale up or down as their requirements change.
- How is Pro different from Premium?
- Premium is a capacity-based license, while Pro is a user-based license. Pro is for those users to publish reports, share dashboards, collaborate with colleagues in workspaces, and engage in other related activities.
- Portal size
- In the case of Pro that comes with Office 365, it will be 10 GB x number of licenses.
- In the case of Premium, you will get 10 TB.